Review


mouse monoclonal anti syt1 antibody  (R&D Systems)


Bioz Verified Symbol R&D Systems is a verified supplier
Bioz Manufacturer Symbol R&D Systems manufactures this product  
  • Logo
  • About
  • News
  • Press Release
  • Team
  • Advisors
  • Partners
  • Contact
  • Bioz Stars
  • Bioz vStars
  • 92

    Structured Review

    R&D Systems mouse monoclonal anti syt1 antibody
    FIGURE 1 Whole mount preparation of the carotid sinus with double immunofluorescence for P2 × 3 (green) and <t>Syt1</t> (red). (a) Low magnification view of the carotid sinus showing P2 × 3-immunoreactive flower-spray nerve endings. Syt1 immunoreactivity is shown in flower-spray endings and in the network of varicose nerve fibers. (b and c) Three-dimensional view of the basal surface of the terminal part of the flower-spray ending indicated in rectangle in Panel a. Arrows indicate thick parent axon for the ending. Panel b shows flower-spray endings could be distinguished from network of thin varicose nerve fibers with Syn1 immunoreactivity. (d–f) Higher magnification view of the rectangle in Panel a. (d) Punctate P2 × 3 immunoreactivity is shown in the terminal part of the endings. (e) Syt1 immunoreactivity is shown as smaller dots in the terminal parts. (f) The merged figure shows that P2 × 3 and Syt1 immunoreactivities are distinct from each other.
    Mouse Monoclonal Anti Syt1 Antibody, supplied by R&D Systems, used in various techniques. Bioz Stars score: 92/100, based on 5 PubMed citations. ZERO BIAS - scores, article reviews, protocol conditions and more
    https://www.bioz.com/product/mouse+monoclonal+anti+syt1+antibody/Rat+Synaptotagmin-1+Antibody/pm38980116-52-1-8
    Average 92 stars, based on 5 article reviews
    mouse monoclonal anti syt1 antibody - by Bioz Stars, 2026-10
    92/100 stars

    Images

    1) Product Images from "Three-Dimensional Ultrastructure of Flower-Spray Nerve Endings in the Rat Carotid Sinus."

    Article Title: Three-Dimensional Ultrastructure of Flower-Spray Nerve Endings in the Rat Carotid Sinus.

    Journal: The Journal of comparative neurology

    doi: 10.1002/cne.25654

    FIGURE 1 Whole mount preparation of the carotid sinus with double immunofluorescence for P2 × 3 (green) and Syt1 (red). (a) Low magnification view of the carotid sinus showing P2 × 3-immunoreactive flower-spray nerve endings. Syt1 immunoreactivity is shown in flower-spray endings and in the network of varicose nerve fibers. (b and c) Three-dimensional view of the basal surface of the terminal part of the flower-spray ending indicated in rectangle in Panel a. Arrows indicate thick parent axon for the ending. Panel b shows flower-spray endings could be distinguished from network of thin varicose nerve fibers with Syn1 immunoreactivity. (d–f) Higher magnification view of the rectangle in Panel a. (d) Punctate P2 × 3 immunoreactivity is shown in the terminal part of the endings. (e) Syt1 immunoreactivity is shown as smaller dots in the terminal parts. (f) The merged figure shows that P2 × 3 and Syt1 immunoreactivities are distinct from each other.
    Figure Legend Snippet: FIGURE 1 Whole mount preparation of the carotid sinus with double immunofluorescence for P2 × 3 (green) and Syt1 (red). (a) Low magnification view of the carotid sinus showing P2 × 3-immunoreactive flower-spray nerve endings. Syt1 immunoreactivity is shown in flower-spray endings and in the network of varicose nerve fibers. (b and c) Three-dimensional view of the basal surface of the terminal part of the flower-spray ending indicated in rectangle in Panel a. Arrows indicate thick parent axon for the ending. Panel b shows flower-spray endings could be distinguished from network of thin varicose nerve fibers with Syn1 immunoreactivity. (d–f) Higher magnification view of the rectangle in Panel a. (d) Punctate P2 × 3 immunoreactivity is shown in the terminal part of the endings. (e) Syt1 immunoreactivity is shown as smaller dots in the terminal parts. (f) The merged figure shows that P2 × 3 and Syt1 immunoreactivities are distinct from each other.

    Techniques Used: Immunofluorescence

    Related Articles

    Immunofluorescence:

    Article Title: Three-Dimensional Ultrastructure of Flower-Spray Nerve Endings in the Rat Carotid Sinus.
    Article Snippet: Syn1 is Ca2+ sensor protein localized to secretory vesicle and plays a regulatory role in neurotransmitter release (Rizo 2022).Syn1 is Ca2+ sensor protein localized to secretory vesicle and plays a regulatory role in neurotransmitter release (Rizo 2022).. A mouse monoclonal anti-Syt1 antibody (clone ASV48, MAB4364, R&D Systems, Minneapolis, MN, USA; RRID AB_2199304) was raised against the rat brain synaptic plasmamembrane (Matthew, Tsavaler, and Reichardt 1981).. An immunoblotting analysis showed a 65-kDa band in the brain extract, whereas immunohistochemistry showed a positive reaction in rat brain neuropils.An immunoblotting analysis showed a 65-kDa band in the brain extract, whereas immunohistochemistry showed a positive reaction in rat brain neuropils.


    Similar Products

    92
    Synaptic Systems mouse monoclonal anti syt1
    Mouse Monoclonal Anti Syt1, supplied by Synaptic Systems, used in various techniques. Bioz Stars score: 92/100, based on 1 PubMed citations. ZERO BIAS - scores, article reviews, protocol conditions and more
    https://www.bioz.com/product/mouse+monoclonal+anti+syt1+antibody/105+011C2/pmc10592349-726-0-5
    Average 92 stars, based on 1 article reviews
    mouse monoclonal anti syt1 - by Bioz Stars, 2026-10
    92/100 stars
      Buy from Supplier

    92
    Bio-Techne corporation rat synaptotagmin-1 antibody
    Rat Synaptotagmin 1 Antibody, supplied by Bio-Techne corporation, used in various techniques. Bioz Stars score: 92/100, based on 1 PubMed citations. ZERO BIAS - scores, article reviews, protocol conditions and more
    https://www.bioz.com/product/mouse+monoclonal+anti+syt1+antibody/Rat+Synaptotagmin-1+Antibody/bio-techne+corporation___mab4364
    Average 92 stars, based on 1 article reviews
    rat synaptotagmin-1 antibody - by Bioz Stars, 2026-10
    92/100 stars
      Buy from Supplier

    92
    R&D Systems mouse monoclonal anti syt1 antibody
    FIGURE 1 Whole mount preparation of the carotid sinus with double immunofluorescence for P2 × 3 (green) and <t>Syt1</t> (red). (a) Low magnification view of the carotid sinus showing P2 × 3-immunoreactive flower-spray nerve endings. Syt1 immunoreactivity is shown in flower-spray endings and in the network of varicose nerve fibers. (b and c) Three-dimensional view of the basal surface of the terminal part of the flower-spray ending indicated in rectangle in Panel a. Arrows indicate thick parent axon for the ending. Panel b shows flower-spray endings could be distinguished from network of thin varicose nerve fibers with Syn1 immunoreactivity. (d–f) Higher magnification view of the rectangle in Panel a. (d) Punctate P2 × 3 immunoreactivity is shown in the terminal part of the endings. (e) Syt1 immunoreactivity is shown as smaller dots in the terminal parts. (f) The merged figure shows that P2 × 3 and Syt1 immunoreactivities are distinct from each other.
    Mouse Monoclonal Anti Syt1 Antibody, supplied by R&D Systems, used in various techniques. Bioz Stars score: 92/100, based on 1 PubMed citations. ZERO BIAS - scores, article reviews, protocol conditions and more
    https://www.bioz.com/product/mouse+monoclonal+anti+syt1+antibody/Rat+Synaptotagmin-1+Antibody/pm38980116-52-1-8
    Average 92 stars, based on 1 article reviews
    mouse monoclonal anti syt1 antibody - by Bioz Stars, 2026-10
    92/100 stars
      Buy from Supplier

    90
    Synaptic Systems mouse monoclonal anti-syt1-l ab
    FIGURE 1 Whole mount preparation of the carotid sinus with double immunofluorescence for P2 × 3 (green) and <t>Syt1</t> (red). (a) Low magnification view of the carotid sinus showing P2 × 3-immunoreactive flower-spray nerve endings. Syt1 immunoreactivity is shown in flower-spray endings and in the network of varicose nerve fibers. (b and c) Three-dimensional view of the basal surface of the terminal part of the flower-spray ending indicated in rectangle in Panel a. Arrows indicate thick parent axon for the ending. Panel b shows flower-spray endings could be distinguished from network of thin varicose nerve fibers with Syn1 immunoreactivity. (d–f) Higher magnification view of the rectangle in Panel a. (d) Punctate P2 × 3 immunoreactivity is shown in the terminal part of the endings. (e) Syt1 immunoreactivity is shown as smaller dots in the terminal parts. (f) The merged figure shows that P2 × 3 and Syt1 immunoreactivities are distinct from each other.
    Mouse Monoclonal Anti Syt1 L Ab, supplied by Synaptic Systems, used in various techniques. Bioz Stars score: 90/100, based on 1 PubMed citations. ZERO BIAS - scores, article reviews, protocol conditions and more
    https://www.bioz.com/product/mouse+monoclonal+anti+syt1+antibody/synaptophysin+antibody/pm37146708-70-14-18
    Average 90 stars, based on 1 article reviews
    mouse monoclonal anti-syt1-l ab - by Bioz Stars, 2026-10
    90/100 stars
      Buy from Supplier

    94
    Synaptic Systems monoclonal mouse anti syt1
    FIGURE 1 Whole mount preparation of the carotid sinus with double immunofluorescence for P2 × 3 (green) and <t>Syt1</t> (red). (a) Low magnification view of the carotid sinus showing P2 × 3-immunoreactive flower-spray nerve endings. Syt1 immunoreactivity is shown in flower-spray endings and in the network of varicose nerve fibers. (b and c) Three-dimensional view of the basal surface of the terminal part of the flower-spray ending indicated in rectangle in Panel a. Arrows indicate thick parent axon for the ending. Panel b shows flower-spray endings could be distinguished from network of thin varicose nerve fibers with Syn1 immunoreactivity. (d–f) Higher magnification view of the rectangle in Panel a. (d) Punctate P2 × 3 immunoreactivity is shown in the terminal part of the endings. (e) Syt1 immunoreactivity is shown as smaller dots in the terminal parts. (f) The merged figure shows that P2 × 3 and Syt1 immunoreactivities are distinct from each other.
    Monoclonal Mouse Anti Syt1, supplied by Synaptic Systems, used in various techniques. Bioz Stars score: 94/100, based on 1 PubMed citations. ZERO BIAS - scores, article reviews, protocol conditions and more
    https://www.bioz.com/product/mouse+monoclonal+anti+syt1+antibody/105+311/pmc08654841-395-46-51
    Average 94 stars, based on 1 article reviews
    monoclonal mouse anti syt1 - by Bioz Stars, 2026-10
    94/100 stars
      Buy from Supplier

    93
    Synaptic Systems biotinylated monoclonal mouse anti syt1 antibody
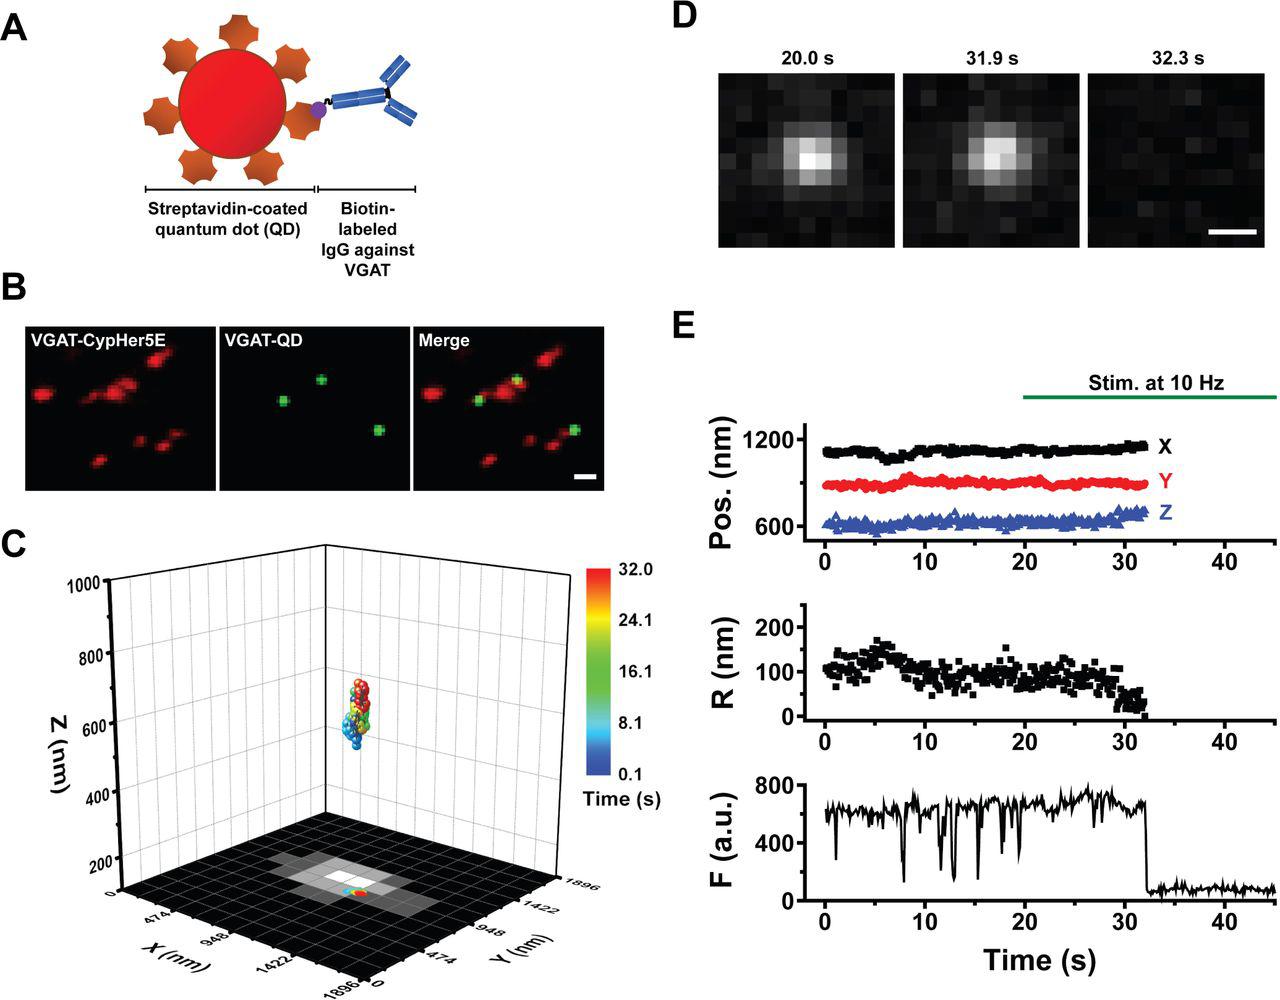
    (A) Schematic diagram depicting a streptavidin-conjugated quantum dot (QD) conjugated to <t>biotinylated</t> antibodies against the luminal domain of VGAT. (B) Colocalization of VGAT-QD‒loaded inhibitory vesicles (green) and CypHer5E-VGAT‒labeled presynaptic boutons (red) in cultured hippocampal neurons. Scale bar: 1 µm. (C) Three-dimensional trajectory of a VGAT-QD‒loaded inhibitory vesicle overlaid on the x - y plane of a CypHer5E-VGAT‒ labeled presynaptic bouton. The color bar represents elapsed time; electrical stimulation (10 Hz) started at 20 s, and the vesicle underwent exocytosis at 32.0 s. (D) Fluorescence images of the VGAT-QD‒loaded vesicle shown in panel C taken at the indicated times. Scale bar: 0.5 µm. (E) Three-dimensional position, radial distance from the momentary position to the fusion site (R), and fluorescence intensity (F) of the VGAT-QD‒loaded vesicle shown in panel C. Note the photoblinking events (e.g., at approximately 8 s, 13 s and 15 s), confirming the presence of one QD inside the vesicle. Electrical stimuli (10 Hz) were applied for 120 s starting at 20 s (green horizontal bar).
    Biotinylated Monoclonal Mouse Anti Syt1 Antibody, supplied by Synaptic Systems, used in various techniques. Bioz Stars score: 93/100, based on 1 PubMed citations. ZERO BIAS - scores, article reviews, protocol conditions and more
    https://www.bioz.com/product/mouse+monoclonal+anti+syt1+antibody/105+311BT/bio_rxiv__2020__09__21__289314-161-1-8
    Average 93 stars, based on 1 article reviews
    biotinylated monoclonal mouse anti syt1 antibody - by Bioz Stars, 2026-10
    93/100 stars
      Buy from Supplier

    90
    Synaptic Systems mouse monoclonal anti-syt1
    KEY RESOURCES TABLE
    Mouse Monoclonal Anti Syt1, supplied by Synaptic Systems, used in various techniques. Bioz Stars score: 90/100, based on 1 PubMed citations. ZERO BIAS - scores, article reviews, protocol conditions and more
    https://www.bioz.com/product/mouse+monoclonal+anti+syt1+antibody/synaptophysin+antibody/pmc06788794-1-0-4
    Average 90 stars, based on 1 article reviews
    mouse monoclonal anti-syt1 - by Bioz Stars, 2026-10
    90/100 stars
      Buy from Supplier

    95
    Synaptic Systems resource source identifier antibodies mouse monoclonal anti syt1 synaptic systems
    A, Coronal image of ventral brainstem immunostained for VGAT (top) and <t>Syt1/Syt2</t> (bottom). Dashed line indicates midline, with reticular formation (RF) and dorsal accessory olive (DAO) outlined. Scalebar, 200 μm. B, High-power single-plane view of VGAT-positive boutons in RF (left) and DAO (right). Raw images shown from top to bottom for VGAT, Syt1/2, merged channels, and correlation analysis. YZ and XY planes indicated by yellow ticks. Scalebar, 1 μm. C, same as in A but for VGLUT2 and Syt1/2. D, same as in B, but for VGLUT2. E, Comparison of confocal (left) and 3D-SIM (right) in the RF. Scalebar, 1 μm. F, Same as in E, but for the DAO. G, Distribution of correlation coefficient values for confocal (dark) and 3D-SIM (light) in the RF (left) and DAO (right). **p<0.01, K-S test. Number of experiments in Table S1. See also Figure S3–4.
    Resource Source Identifier Antibodies Mouse Monoclonal Anti Syt1 Synaptic Systems, supplied by Synaptic Systems, used in various techniques. Bioz Stars score: 95/100, based on 1 PubMed citations. ZERO BIAS - scores, article reviews, protocol conditions and more
    https://www.bioz.com/product/mouse+monoclonal+anti+syt1+antibody/105+011/pmc06788794-840-3-10
    Average 95 stars, based on 1 article reviews
    resource source identifier antibodies mouse monoclonal anti syt1 synaptic systems - by Bioz Stars, 2026-10
    95/100 stars
      Buy from Supplier

    Image Search Results


    FIGURE 1 Whole mount preparation of the carotid sinus with double immunofluorescence for P2 × 3 (green) and Syt1 (red). (a) Low magnification view of the carotid sinus showing P2 × 3-immunoreactive flower-spray nerve endings. Syt1 immunoreactivity is shown in flower-spray endings and in the network of varicose nerve fibers. (b and c) Three-dimensional view of the basal surface of the terminal part of the flower-spray ending indicated in rectangle in Panel a. Arrows indicate thick parent axon for the ending. Panel b shows flower-spray endings could be distinguished from network of thin varicose nerve fibers with Syn1 immunoreactivity. (d–f) Higher magnification view of the rectangle in Panel a. (d) Punctate P2 × 3 immunoreactivity is shown in the terminal part of the endings. (e) Syt1 immunoreactivity is shown as smaller dots in the terminal parts. (f) The merged figure shows that P2 × 3 and Syt1 immunoreactivities are distinct from each other.

    Journal: The Journal of comparative neurology

    Article Title: Three-Dimensional Ultrastructure of Flower-Spray Nerve Endings in the Rat Carotid Sinus.

    doi: 10.1002/cne.25654

    Figure Lengend Snippet: FIGURE 1 Whole mount preparation of the carotid sinus with double immunofluorescence for P2 × 3 (green) and Syt1 (red). (a) Low magnification view of the carotid sinus showing P2 × 3-immunoreactive flower-spray nerve endings. Syt1 immunoreactivity is shown in flower-spray endings and in the network of varicose nerve fibers. (b and c) Three-dimensional view of the basal surface of the terminal part of the flower-spray ending indicated in rectangle in Panel a. Arrows indicate thick parent axon for the ending. Panel b shows flower-spray endings could be distinguished from network of thin varicose nerve fibers with Syn1 immunoreactivity. (d–f) Higher magnification view of the rectangle in Panel a. (d) Punctate P2 × 3 immunoreactivity is shown in the terminal part of the endings. (e) Syt1 immunoreactivity is shown as smaller dots in the terminal parts. (f) The merged figure shows that P2 × 3 and Syt1 immunoreactivities are distinct from each other.

    Article Snippet: A mouse monoclonal anti-Syt1 antibody (clone ASV48, MAB4364, R&D Systems, Minneapolis, MN, USA; RRID AB_2199304) was raised against the rat brain synaptic plasmamembrane (Matthew, Tsavaler, and Reichardt 1981).

    Techniques: Immunofluorescence

    (A) Schematic diagram depicting a streptavidin-conjugated quantum dot (QD) conjugated to biotinylated antibodies against the luminal domain of VGAT. (B) Colocalization of VGAT-QD‒loaded inhibitory vesicles (green) and CypHer5E-VGAT‒labeled presynaptic boutons (red) in cultured hippocampal neurons. Scale bar: 1 µm. (C) Three-dimensional trajectory of a VGAT-QD‒loaded inhibitory vesicle overlaid on the x - y plane of a CypHer5E-VGAT‒ labeled presynaptic bouton. The color bar represents elapsed time; electrical stimulation (10 Hz) started at 20 s, and the vesicle underwent exocytosis at 32.0 s. (D) Fluorescence images of the VGAT-QD‒loaded vesicle shown in panel C taken at the indicated times. Scale bar: 0.5 µm. (E) Three-dimensional position, radial distance from the momentary position to the fusion site (R), and fluorescence intensity (F) of the VGAT-QD‒loaded vesicle shown in panel C. Note the photoblinking events (e.g., at approximately 8 s, 13 s and 15 s), confirming the presence of one QD inside the vesicle. Electrical stimuli (10 Hz) were applied for 120 s starting at 20 s (green horizontal bar).

    Journal: bioRxiv

    Article Title: Inhibitory synaptic vesicles have unique dynamics and exocytosis properties

    doi: 10.1101/2020.09.21.289314

    Figure Lengend Snippet: (A) Schematic diagram depicting a streptavidin-conjugated quantum dot (QD) conjugated to biotinylated antibodies against the luminal domain of VGAT. (B) Colocalization of VGAT-QD‒loaded inhibitory vesicles (green) and CypHer5E-VGAT‒labeled presynaptic boutons (red) in cultured hippocampal neurons. Scale bar: 1 µm. (C) Three-dimensional trajectory of a VGAT-QD‒loaded inhibitory vesicle overlaid on the x - y plane of a CypHer5E-VGAT‒ labeled presynaptic bouton. The color bar represents elapsed time; electrical stimulation (10 Hz) started at 20 s, and the vesicle underwent exocytosis at 32.0 s. (D) Fluorescence images of the VGAT-QD‒loaded vesicle shown in panel C taken at the indicated times. Scale bar: 0.5 µm. (E) Three-dimensional position, radial distance from the momentary position to the fusion site (R), and fluorescence intensity (F) of the VGAT-QD‒loaded vesicle shown in panel C. Note the photoblinking events (e.g., at approximately 8 s, 13 s and 15 s), confirming the presence of one QD inside the vesicle. Electrical stimuli (10 Hz) were applied for 120 s starting at 20 s (green horizontal bar).

    Article Snippet: The biotinylated monoclonal mouse anti-Syt1 antibody (105 311BT, Synaptic Systems) or the biotinylated anti-VGAT antibody (131 103CpH, Synaptic Systems) was conjugated to streptavidin-conjugated quantum dots (cat. A10196, Thermo Fisher Scientific), and vesicles were loaded as described previously ( ).

    Techniques: Cell Culture, Labeling, Fluorescence

    Cumulative distribution of the net displacement between the initial location and fusion site (A) , fusion time (B) , and total length traveled (C) for VGAT-QD‒labeled synaptic vesicles (n = 80 vesicles) and Syt1-QD‒loaded synaptic vesicles (n = 49 vesicles). * p <0.05, ** p <0.01, and NS, not significant (Kolmogorov-Smirnov test (K-S test)).

    Journal: bioRxiv

    Article Title: Inhibitory synaptic vesicles have unique dynamics and exocytosis properties

    doi: 10.1101/2020.09.21.289314

    Figure Lengend Snippet: Cumulative distribution of the net displacement between the initial location and fusion site (A) , fusion time (B) , and total length traveled (C) for VGAT-QD‒labeled synaptic vesicles (n = 80 vesicles) and Syt1-QD‒loaded synaptic vesicles (n = 49 vesicles). * p <0.05, ** p <0.01, and NS, not significant (Kolmogorov-Smirnov test (K-S test)).

    Article Snippet: The biotinylated monoclonal mouse anti-Syt1 antibody (105 311BT, Synaptic Systems) or the biotinylated anti-VGAT antibody (131 103CpH, Synaptic Systems) was conjugated to streptavidin-conjugated quantum dots (cat. A10196, Thermo Fisher Scientific), and vesicles were loaded as described previously ( ).

    Techniques:

    (A) Fusion time is plotted against the net displacement; each symbol represents an individual VGAT-QD‒loaded inhibitory vesicle, and the solid red line represents the linear regression (Pearson’s r = 0.77). (B) Cumulative distribution of net velocity measured for VGAT-QD‒labeled synaptic vesicles and Syt1-QD‒loaded synaptic vesicles. (C) Fusion time is plotted against the total travel length; each symbol represents an individual VGAT-QD‒loaded inhibitory vesicle, and the solid red line represents the linear regression (Pearson’s r = 0.94). (D) Cumulative distribution of vesicle speed measured for VGAT-QD‒labeled synaptic vesicles and Syt1-QD‒loaded synaptic vesicles. ** p <0.01 and NS, not significant (K-S test).

    Journal: bioRxiv

    Article Title: Inhibitory synaptic vesicles have unique dynamics and exocytosis properties

    doi: 10.1101/2020.09.21.289314

    Figure Lengend Snippet: (A) Fusion time is plotted against the net displacement; each symbol represents an individual VGAT-QD‒loaded inhibitory vesicle, and the solid red line represents the linear regression (Pearson’s r = 0.77). (B) Cumulative distribution of net velocity measured for VGAT-QD‒labeled synaptic vesicles and Syt1-QD‒loaded synaptic vesicles. (C) Fusion time is plotted against the total travel length; each symbol represents an individual VGAT-QD‒loaded inhibitory vesicle, and the solid red line represents the linear regression (Pearson’s r = 0.94). (D) Cumulative distribution of vesicle speed measured for VGAT-QD‒labeled synaptic vesicles and Syt1-QD‒loaded synaptic vesicles. ** p <0.01 and NS, not significant (K-S test).

    Article Snippet: The biotinylated monoclonal mouse anti-Syt1 antibody (105 311BT, Synaptic Systems) or the biotinylated anti-VGAT antibody (131 103CpH, Synaptic Systems) was conjugated to streptavidin-conjugated quantum dots (cat. A10196, Thermo Fisher Scientific), and vesicles were loaded as described previously ( ).

    Techniques:

    (A) Fluorescence images taken at the indicated times for an inhibitory vesicle loaded with a VGAT-conjugated QD; electrical stimuli (10 Hz) were applied at 20 s. The intersection of the perpendicular lines marked the position before the first fusion. Scale bar: 0.5 μm. (B) Three-dimensional position, radial distance (R), and fluorescence (F) of a VGAT-QD‒ loaded vesicle that underwent kiss-and-run (K&R) fusion (red arrow) followed by full-collapse fusion (FCF, blue arrow). Electrical stimuli (10 Hz) were applied for 120 s starting at 20 s (green horizontal bar). (C) Average normalized fluorescence intensity traces (with SEM) time-aligned to the first fusion event for vesicles that underwent full-collapse fusion (FCF) (C1), vesicles that underwent kiss-and-run (K&R) fusion followed by FCF (C2), and vesicles that underwent K&R fusion but never underwent FCF (C3). The dotted horizontal line represents a normalized fluorescence intensity value of 0.12, (the expected normalized fluorescence right after full-collapse fusion). (D) Relative distribution of the fusion modes measured in VGAT-QD‒labeled vesicles (D1) and Syt1-QD‒loaded vesicles (D2) that underwent exocytosis, showing that 65% and 27% of vesicles, respectively, underwent K&R fusion. (E-F) Cumulative distribution of total travel length for inhibitory and excitatory vesicles that underwent either FCF (E) or K&R fusion (F). (G-H) Cumulative distribution of fusion time for inhibitory and excitatory vesicles that underwent either FCF (G) or K&R fusion (H). * p <0.05, ** p <0.01, and NS, not significant (K-S test).

    Journal: bioRxiv

    Article Title: Inhibitory synaptic vesicles have unique dynamics and exocytosis properties

    doi: 10.1101/2020.09.21.289314

    Figure Lengend Snippet: (A) Fluorescence images taken at the indicated times for an inhibitory vesicle loaded with a VGAT-conjugated QD; electrical stimuli (10 Hz) were applied at 20 s. The intersection of the perpendicular lines marked the position before the first fusion. Scale bar: 0.5 μm. (B) Three-dimensional position, radial distance (R), and fluorescence (F) of a VGAT-QD‒ loaded vesicle that underwent kiss-and-run (K&R) fusion (red arrow) followed by full-collapse fusion (FCF, blue arrow). Electrical stimuli (10 Hz) were applied for 120 s starting at 20 s (green horizontal bar). (C) Average normalized fluorescence intensity traces (with SEM) time-aligned to the first fusion event for vesicles that underwent full-collapse fusion (FCF) (C1), vesicles that underwent kiss-and-run (K&R) fusion followed by FCF (C2), and vesicles that underwent K&R fusion but never underwent FCF (C3). The dotted horizontal line represents a normalized fluorescence intensity value of 0.12, (the expected normalized fluorescence right after full-collapse fusion). (D) Relative distribution of the fusion modes measured in VGAT-QD‒labeled vesicles (D1) and Syt1-QD‒loaded vesicles (D2) that underwent exocytosis, showing that 65% and 27% of vesicles, respectively, underwent K&R fusion. (E-F) Cumulative distribution of total travel length for inhibitory and excitatory vesicles that underwent either FCF (E) or K&R fusion (F). (G-H) Cumulative distribution of fusion time for inhibitory and excitatory vesicles that underwent either FCF (G) or K&R fusion (H). * p <0.05, ** p <0.01, and NS, not significant (K-S test).

    Article Snippet: The biotinylated monoclonal mouse anti-Syt1 antibody (105 311BT, Synaptic Systems) or the biotinylated anti-VGAT antibody (131 103CpH, Synaptic Systems) was conjugated to streptavidin-conjugated quantum dots (cat. A10196, Thermo Fisher Scientific), and vesicles were loaded as described previously ( ).

    Techniques: Fluorescence

    KEY RESOURCES TABLE

    Journal: Neuron

    Article Title: Neuronal regulation of fast synaptotagmin isoforms controls the relative contributions of synchronous and asynchronous release

    doi: 10.1016/j.neuron.2019.01.013

    Figure Lengend Snippet: KEY RESOURCES TABLE

    Article Snippet: Mouse monoclonal anti-Syt1 , Synaptic Systems , Cat# 105011 RRID:AB_887831.

    Techniques: Plasmid Preparation, Virus, Software

    A, Coronal image of ventral brainstem immunostained for VGAT (top) and Syt1/Syt2 (bottom). Dashed line indicates midline, with reticular formation (RF) and dorsal accessory olive (DAO) outlined. Scalebar, 200 μm. B, High-power single-plane view of VGAT-positive boutons in RF (left) and DAO (right). Raw images shown from top to bottom for VGAT, Syt1/2, merged channels, and correlation analysis. YZ and XY planes indicated by yellow ticks. Scalebar, 1 μm. C, same as in A but for VGLUT2 and Syt1/2. D, same as in B, but for VGLUT2. E, Comparison of confocal (left) and 3D-SIM (right) in the RF. Scalebar, 1 μm. F, Same as in E, but for the DAO. G, Distribution of correlation coefficient values for confocal (dark) and 3D-SIM (light) in the RF (left) and DAO (right). **p<0.01, K-S test. Number of experiments in Table S1. See also Figure S3–4.

    Journal: Neuron

    Article Title: Neuronal regulation of fast synaptotagmin isoforms controls the relative contributions of synchronous and asynchronous release

    doi: 10.1016/j.neuron.2019.01.013

    Figure Lengend Snippet: A, Coronal image of ventral brainstem immunostained for VGAT (top) and Syt1/Syt2 (bottom). Dashed line indicates midline, with reticular formation (RF) and dorsal accessory olive (DAO) outlined. Scalebar, 200 μm. B, High-power single-plane view of VGAT-positive boutons in RF (left) and DAO (right). Raw images shown from top to bottom for VGAT, Syt1/2, merged channels, and correlation analysis. YZ and XY planes indicated by yellow ticks. Scalebar, 1 μm. C, same as in A but for VGLUT2 and Syt1/2. D, same as in B, but for VGLUT2. E, Comparison of confocal (left) and 3D-SIM (right) in the RF. Scalebar, 1 μm. F, Same as in E, but for the DAO. G, Distribution of correlation coefficient values for confocal (dark) and 3D-SIM (light) in the RF (left) and DAO (right). **p<0.01, K-S test. Number of experiments in Table S1. See also Figure S3–4.

    Article Snippet: ​ REAGENT or RESOURCE SOURCE IDENTIFIER Antibodies Mouse monoclonal anti-Syt1 Synaptic Systems Cat# 105011 RRID:AB_887831 Mouse monoclonal anti-Syt2 Zirc Cat# Znp-1 RRID: AB_10013783 Mouse monoclonal anti-Syt7, clone N275/14 UC Davis / NIH NeuroMab Cat# RRID: AB_11030371 Guinea-pig polyclonal anti-VGAT Synaptic Systems Cat# 131004 RRID: AB_887873 Guinea-pig polyclonal anti-VGLUT2 Synaptic Systems Cat# 135404 RRID: AB_887884 Goat anti-guinea-pig AlexaFluor488 Abcam Cat# {"type":"entrez-nucleotide","attrs":{"text":"Ab150185","term_id":"62171003","term_text":"AB150185"}} Ab150185 Goat anti-guinea-pig DyLight 594 Abcam Cat# {"type":"entrez-nucleotide","attrs":{"text":"Ab102376","term_id":"33353552","term_text":"AB102376"}} Ab102376 Goat anti-guinea-mouse AlexaFluor568 Abcam Cat# Ab175473 Goat anti-guinea-mouse AlexaFluor647 Abcam Cat# {"type":"entrez-nucleotide","attrs":{"text":"Ab150115","term_id":"62170933","term_text":"AB150115"}} Ab150115 Experimental Models: Organisms / Strains C57/BL6 Charles River N/A B6.129S1- Syt7 tm1Nan /J Jackson Labs JAX:004950 RRID : IMSR_JAX: 004950 Viruses AAV 9-hSyn-ChR2-YFP UPenn Vector Core 26973-AAV9 AAV 9-hSyn-ChR2-YFP-2A-Syt1 Boston Children’s Virus Core N/A Chemicals NBQX disodium salt Abcam Cat# ab120046 (R,S)-CPP Abcam Cat# ab120160 SR95531 Abcam Cat# ab120042 Strychnine HCl Sigma Cat# S-8753 TTA-P2 Alomone labs Cat# T-155 Software and Algorithms Igor Pro Wavemetrics https://www.wavemetrics.com/ Matlab Mathworks https://www.mathworks.com/products/matlab.html ImageJ/FIJI NIH https://fiji.sc/ FluoView Olympus https://www.olympus-lifescience.com/ Open in a separate window KEY RESOURCES TABLE The release kinetics of GABA in the inferior olive (IO) are regionally segregated In the absence of Syt7 asynchronous release is prominent but with altered kinetics Viral expression of fast Syts transforms asynchronous synapses into synchronous ones Asynchronous GABA release in the IO is a consequence of a lack of fast Syt isoforms

    Techniques:

    A, GABAergic boutons in the PIO expressing ChR2-YFP alone immunostained for VGAT and Syt1. Scalebar, 2 μm. B, Same as in A but expressing ChR2-YFP and Syt1. C, Release evoked by optical simulation in one cell when ChR2 was expressed alone (top) and map of decay time for all cells in the rostral IO (bottom) D, Same as in C, but for ChR2 and Syt1 expression. E, Summary of decay time for optical stimulation of ChR2 alone or ChR2+Syt1 in the PIO. F, Same as in E but for rise time. Markers are individual cells. **p<0.01, Two-tailed Student’s t-test. Number of experiments in Table S1.

    Journal: Neuron

    Article Title: Neuronal regulation of fast synaptotagmin isoforms controls the relative contributions of synchronous and asynchronous release

    doi: 10.1016/j.neuron.2019.01.013

    Figure Lengend Snippet: A, GABAergic boutons in the PIO expressing ChR2-YFP alone immunostained for VGAT and Syt1. Scalebar, 2 μm. B, Same as in A but expressing ChR2-YFP and Syt1. C, Release evoked by optical simulation in one cell when ChR2 was expressed alone (top) and map of decay time for all cells in the rostral IO (bottom) D, Same as in C, but for ChR2 and Syt1 expression. E, Summary of decay time for optical stimulation of ChR2 alone or ChR2+Syt1 in the PIO. F, Same as in E but for rise time. Markers are individual cells. **p<0.01, Two-tailed Student’s t-test. Number of experiments in Table S1.

    Article Snippet: ​ REAGENT or RESOURCE SOURCE IDENTIFIER Antibodies Mouse monoclonal anti-Syt1 Synaptic Systems Cat# 105011 RRID:AB_887831 Mouse monoclonal anti-Syt2 Zirc Cat# Znp-1 RRID: AB_10013783 Mouse monoclonal anti-Syt7, clone N275/14 UC Davis / NIH NeuroMab Cat# RRID: AB_11030371 Guinea-pig polyclonal anti-VGAT Synaptic Systems Cat# 131004 RRID: AB_887873 Guinea-pig polyclonal anti-VGLUT2 Synaptic Systems Cat# 135404 RRID: AB_887884 Goat anti-guinea-pig AlexaFluor488 Abcam Cat# {"type":"entrez-nucleotide","attrs":{"text":"Ab150185","term_id":"62171003","term_text":"AB150185"}} Ab150185 Goat anti-guinea-pig DyLight 594 Abcam Cat# {"type":"entrez-nucleotide","attrs":{"text":"Ab102376","term_id":"33353552","term_text":"AB102376"}} Ab102376 Goat anti-guinea-mouse AlexaFluor568 Abcam Cat# Ab175473 Goat anti-guinea-mouse AlexaFluor647 Abcam Cat# {"type":"entrez-nucleotide","attrs":{"text":"Ab150115","term_id":"62170933","term_text":"AB150115"}} Ab150115 Experimental Models: Organisms / Strains C57/BL6 Charles River N/A B6.129S1- Syt7 tm1Nan /J Jackson Labs JAX:004950 RRID : IMSR_JAX: 004950 Viruses AAV 9-hSyn-ChR2-YFP UPenn Vector Core 26973-AAV9 AAV 9-hSyn-ChR2-YFP-2A-Syt1 Boston Children’s Virus Core N/A Chemicals NBQX disodium salt Abcam Cat# ab120046 (R,S)-CPP Abcam Cat# ab120160 SR95531 Abcam Cat# ab120042 Strychnine HCl Sigma Cat# S-8753 TTA-P2 Alomone labs Cat# T-155 Software and Algorithms Igor Pro Wavemetrics https://www.wavemetrics.com/ Matlab Mathworks https://www.mathworks.com/products/matlab.html ImageJ/FIJI NIH https://fiji.sc/ FluoView Olympus https://www.olympus-lifescience.com/ Open in a separate window KEY RESOURCES TABLE The release kinetics of GABA in the inferior olive (IO) are regionally segregated In the absence of Syt7 asynchronous release is prominent but with altered kinetics Viral expression of fast Syts transforms asynchronous synapses into synchronous ones Asynchronous GABA release in the IO is a consequence of a lack of fast Syt isoforms

    Techniques: Expressing, Two Tailed Test

    A, Example single-plane views of GABAergic boutons, Syt1/2, and correlation analysis for IO subnuclei. Scalebar, 2 μm. B, Distribution of correlation coefficient values for all regions normalized by number of boutons within each subnucleus. C, Map of correlation coefficient values for rostral (left) and caudal (right) ventral brainstem (top) with IO subnuclei segmented and labeled (bottom). Scalebar, 200 μm. D, Map of the rostral (left) and caudal (right) IO color mapped for the average IPSC τdecay. E, Plot of the fraction of GABAergic boutons lacking Syt1/2 (R2 < 0.1, empty markers) and average IPSC decay time (filled gray) for subnuclei and reticular formation (RF). F, Plot of average IPSC decay time vs. fraction of VGAT boutons lacking Syt1/2 (R2 < 0.1). Each marker is data from one subnucleus. Physiology data are mean ± s.e.m., anatomy are individual animals. Number of experiments in Table S1.

    Journal: Neuron

    Article Title: Neuronal regulation of fast synaptotagmin isoforms controls the relative contributions of synchronous and asynchronous release

    doi: 10.1016/j.neuron.2019.01.013

    Figure Lengend Snippet: A, Example single-plane views of GABAergic boutons, Syt1/2, and correlation analysis for IO subnuclei. Scalebar, 2 μm. B, Distribution of correlation coefficient values for all regions normalized by number of boutons within each subnucleus. C, Map of correlation coefficient values for rostral (left) and caudal (right) ventral brainstem (top) with IO subnuclei segmented and labeled (bottom). Scalebar, 200 μm. D, Map of the rostral (left) and caudal (right) IO color mapped for the average IPSC τdecay. E, Plot of the fraction of GABAergic boutons lacking Syt1/2 (R2 < 0.1, empty markers) and average IPSC decay time (filled gray) for subnuclei and reticular formation (RF). F, Plot of average IPSC decay time vs. fraction of VGAT boutons lacking Syt1/2 (R2 < 0.1). Each marker is data from one subnucleus. Physiology data are mean ± s.e.m., anatomy are individual animals. Number of experiments in Table S1.

    Article Snippet: ​ REAGENT or RESOURCE SOURCE IDENTIFIER Antibodies Mouse monoclonal anti-Syt1 Synaptic Systems Cat# 105011 RRID:AB_887831 Mouse monoclonal anti-Syt2 Zirc Cat# Znp-1 RRID: AB_10013783 Mouse monoclonal anti-Syt7, clone N275/14 UC Davis / NIH NeuroMab Cat# RRID: AB_11030371 Guinea-pig polyclonal anti-VGAT Synaptic Systems Cat# 131004 RRID: AB_887873 Guinea-pig polyclonal anti-VGLUT2 Synaptic Systems Cat# 135404 RRID: AB_887884 Goat anti-guinea-pig AlexaFluor488 Abcam Cat# {"type":"entrez-nucleotide","attrs":{"text":"Ab150185","term_id":"62171003","term_text":"AB150185"}} Ab150185 Goat anti-guinea-pig DyLight 594 Abcam Cat# {"type":"entrez-nucleotide","attrs":{"text":"Ab102376","term_id":"33353552","term_text":"AB102376"}} Ab102376 Goat anti-guinea-mouse AlexaFluor568 Abcam Cat# Ab175473 Goat anti-guinea-mouse AlexaFluor647 Abcam Cat# {"type":"entrez-nucleotide","attrs":{"text":"Ab150115","term_id":"62170933","term_text":"AB150115"}} Ab150115 Experimental Models: Organisms / Strains C57/BL6 Charles River N/A B6.129S1- Syt7 tm1Nan /J Jackson Labs JAX:004950 RRID : IMSR_JAX: 004950 Viruses AAV 9-hSyn-ChR2-YFP UPenn Vector Core 26973-AAV9 AAV 9-hSyn-ChR2-YFP-2A-Syt1 Boston Children’s Virus Core N/A Chemicals NBQX disodium salt Abcam Cat# ab120046 (R,S)-CPP Abcam Cat# ab120160 SR95531 Abcam Cat# ab120042 Strychnine HCl Sigma Cat# S-8753 TTA-P2 Alomone labs Cat# T-155 Software and Algorithms Igor Pro Wavemetrics https://www.wavemetrics.com/ Matlab Mathworks https://www.mathworks.com/products/matlab.html ImageJ/FIJI NIH https://fiji.sc/ FluoView Olympus https://www.olympus-lifescience.com/ Open in a separate window KEY RESOURCES TABLE The release kinetics of GABA in the inferior olive (IO) are regionally segregated In the absence of Syt7 asynchronous release is prominent but with altered kinetics Viral expression of fast Syts transforms asynchronous synapses into synchronous ones Asynchronous GABA release in the IO is a consequence of a lack of fast Syt isoforms

    Techniques: Labeling, Marker

    KEY RESOURCES TABLE

    Journal: Neuron

    Article Title: Neuronal regulation of fast synaptotagmin isoforms controls the relative contributions of synchronous and asynchronous release

    doi: 10.1016/j.neuron.2019.01.013

    Figure Lengend Snippet: KEY RESOURCES TABLE

    Article Snippet: ​ REAGENT or RESOURCE SOURCE IDENTIFIER Antibodies Mouse monoclonal anti-Syt1 Synaptic Systems Cat# 105011 RRID:AB_887831 Mouse monoclonal anti-Syt2 Zirc Cat# Znp-1 RRID: AB_10013783 Mouse monoclonal anti-Syt7, clone N275/14 UC Davis / NIH NeuroMab Cat# RRID: AB_11030371 Guinea-pig polyclonal anti-VGAT Synaptic Systems Cat# 131004 RRID: AB_887873 Guinea-pig polyclonal anti-VGLUT2 Synaptic Systems Cat# 135404 RRID: AB_887884 Goat anti-guinea-pig AlexaFluor488 Abcam Cat# {"type":"entrez-nucleotide","attrs":{"text":"Ab150185","term_id":"62171003","term_text":"AB150185"}} Ab150185 Goat anti-guinea-pig DyLight 594 Abcam Cat# {"type":"entrez-nucleotide","attrs":{"text":"Ab102376","term_id":"33353552","term_text":"AB102376"}} Ab102376 Goat anti-guinea-mouse AlexaFluor568 Abcam Cat# Ab175473 Goat anti-guinea-mouse AlexaFluor647 Abcam Cat# {"type":"entrez-nucleotide","attrs":{"text":"Ab150115","term_id":"62170933","term_text":"AB150115"}} Ab150115 Experimental Models: Organisms / Strains C57/BL6 Charles River N/A B6.129S1- Syt7 tm1Nan /J Jackson Labs JAX:004950 RRID : IMSR_JAX: 004950 Viruses AAV 9-hSyn-ChR2-YFP UPenn Vector Core 26973-AAV9 AAV 9-hSyn-ChR2-YFP-2A-Syt1 Boston Children’s Virus Core N/A Chemicals NBQX disodium salt Abcam Cat# ab120046 (R,S)-CPP Abcam Cat# ab120160 SR95531 Abcam Cat# ab120042 Strychnine HCl Sigma Cat# S-8753 TTA-P2 Alomone labs Cat# T-155 Software and Algorithms Igor Pro Wavemetrics https://www.wavemetrics.com/ Matlab Mathworks https://www.mathworks.com/products/matlab.html ImageJ/FIJI NIH https://fiji.sc/ FluoView Olympus https://www.olympus-lifescience.com/ Open in a separate window KEY RESOURCES TABLE The release kinetics of GABA in the inferior olive (IO) are regionally segregated In the absence of Syt7 asynchronous release is prominent but with altered kinetics Viral expression of fast Syts transforms asynchronous synapses into synchronous ones Asynchronous GABA release in the IO is a consequence of a lack of fast Syt isoforms

    Techniques: Plasmid Preparation, Software